- From Market Euphoria to a Crisis of Confidence
At the beginning of 2026, Indonesia’s stock market was trading near historic highs. The Jakarta Composite Index (IHSG) reached approximately 9,134.70 in January, creating expectations that the market could sustain its upward trajectory.
That optimism has since been severely tested.
On October 16, 2026, the IHSG closed at 5,185.10 following a sharp sell-off triggered by MSCI’s proposal to consider reclassifying Indonesia from an emerging market to a standalone market.
From the January peak to the October 16 close, the index had fallen approximately 43%.
This is more than a routine market correction. A decline of this magnitude raises questions about valuation, investor confidence, capital flows, market liquidity, and the credibility of the institutions supporting the market.
The central question is not simply why Indonesian stocks are falling.
It is whether the market is experiencing a temporary liquidity shock, a structural repricing of Indonesian risk, or a combination of both.
The distinction matters because each scenario produces different implications for investors, companies, and the Indonesian economy.
- What Actually Happened on October 16?
The immediate catalyst was MSCI’s announcement on October 15 that it had launched a consultation on a proposal to reclassify Indonesia’s equity market from Emerging Market to Standalone Market status.
MSCI cited persistent concerns raised by market participants about the investability of Indonesian equities, including:
-
Opaque shareholding structures.
-
Concentrated share ownership.
-
Suspected coordinated trading activity.
-
Insufficient evidence that announced reforms had materially improved market transparency and functioning.
MSCI also stated that the existing freeze on certain index-related changes for Indonesian securities would remain in place until further notice.
The market reaction was severe. On October 16, the IHSG fell 11.57% to 5,185.10, marking one of its most dramatic daily declines in decades.
This reaction demonstrates how rapidly confidence can deteriorate when a market faces not only economic uncertainty but also questions about whether international investors can reliably access, trade, and value its securities.
Important distinction: MSCI has not yet made a final decision to downgrade Indonesia. The consultation is scheduled to run until April 30, 2027, with a final decision expected by June 30,
However, markets do not always wait for an official decision before repricing risk. Investors can begin adjusting portfolios as soon as the probability of an adverse outcome increases.
- The Three Layers Behind the IHSG Decline
A sell-off of this scale is rarely explained by one variable. The more useful framework separates the pressure into macroeconomic conditions, market structure, and investor sentiment.
Layer 1: Macroeconomic Pressure
Equity valuations depend partly on expectations for future corporate earnings and the discount rates applied to those earnings.
When economic uncertainty increases, both variables can deteriorate simultaneously.
Several macroeconomic channels are particularly relevant to Indonesia.
A. Rupiah weakness
A weaker rupiah can create different outcomes for different companies.
Exporters with substantial dollar revenues may benefit from currency translation, while companies dependent on imported materials, foreign-currency debt, or overseas equipment can face higher costs.
Currency depreciation can also make Indonesian assets less attractive to foreign investors when returns are measured in US dollars.
A local investor may experience a smaller loss than a foreign investor whose equity returns are further reduced by currency depreciation.
This creates a feedback loop: foreign selling can weaken the currency, and currency weakness can increase pressure on foreign-currency returns.
B. Global interest rates and the US dollar
When global yields rise or the US dollar strengthens, investors may demand a higher return for holding emerging-market assets.
Higher required returns can reduce the present value of future corporate cash flows.
The effect is especially important for businesses whose valuations depend heavily on profits expected many years into the future.
C. Geopolitical uncertainty
Geopolitical tensions can influence energy prices, shipping costs, inflation expectations, and global risk appetite.
When investors become more defensive, they may reduce exposure to markets perceived as having higher liquidity, currency, or governance risks.
Indonesia can therefore experience selling pressure even when the original shock occurs outside its borders.
D. Fiscal and policy credibility
Investors also assess whether fiscal policy, government spending, taxation, regulation, and economic priorities are predictable.
Policy uncertainty does not automatically imply deteriorating economic fundamentals. However, uncertainty can increase the risk premium investors require before committing capital.
The result can be lower valuation multiples even when a company’s current earnings remain relatively stable.
Layer 2: Market Structure and Governance
Macroeconomic pressure alone does not fully explain why the MSCI announcement became such a powerful catalyst.
The second layer concerns the market’s ability to provide transparent ownership information, credible price discovery, and sufficient investability for international capital.
Free float is not the same as total market capitalization.
A company can have a large market capitalization but a relatively small proportion of shares genuinely available for public trading.
If ownership is concentrated, the effective supply of shares available to investors may be much smaller than the headline market capitalization suggests.
This can create several problems:
-
Reported market size may overstate the capital that can realistically be invested.
-
Trading prices may become more sensitive to concentrated buying or selling.
-
Liquidity can deteriorate rapidly when a large investor attempts to exit.
-
Index weights may not accurately represent the amount of capital that can be deployed efficiently.
MSCI’s concerns are therefore not merely administrative. They relate directly to how international investors assess market accessibility, liquidity, and the reliability of index construction.
Indonesia’s announced reforms include enhanced disclosure of shareholders with ownership above 1%, more granular investor classification, High Shareholding Concentration reporting, and a roadmap toward a minimum free-float requirement of 15%.
The critical issue is implementation.
Announcing a reform and demonstrating that it works consistently across the market are two different things.
International investors need evidence that ownership disclosures are reliable, market abuse is addressed, and trading conditions improve in practice.
Until that evidence becomes convincing, a governance-related risk premium can remain embedded in Indonesian equity valuations.
Layer 3: Sentiment, Positioning, and Liquidity
The third layer explains why market movements can become much larger than the initial news might appear to justify.
Investors do not make decisions solely on fundamental value. They also respond to risk limits, liquidity requirements, portfolio benchmarks, and the behavior of other market participants.
A potential index reclassification creates uncertainty about future capital flows.
Investors may respond by reducing exposure before a final decision, particularly if they believe other investors will do the same.
This can create a self-reinforcing cycle:
Negative announcement → portfolio de-risking → lower liquidity → sharper price declines → tighter risk limits → further selling.
Several mechanisms can amplify the move:
-
Stop-loss orders can accelerate declines when key levels break.
-
Leveraged positions may be reduced as volatility rises.
-
Institutional investors may cut positions to meet portfolio risk limits.
-
Market makers may become less willing to provide liquidity during extreme volatility.
-
Domestic investors may sell because they fear further declines, regardless of the long-term value of individual companies.
This is why a market can fall sharply even when not every listed company has experienced a comparable deterioration in earnings.
The index reflects both fundamental expectations and the price at which investors are willing or forced to trade.
- The Standalone Market Threat: Why It Matters
MSCI classifications influence how international investors organize their equity allocations.
The major categories include Developed Markets, Emerging Markets, Frontier Markets, and Standalone Markets.
These classifications are not simply labels describing a country's income level. They also reflect market accessibility, size, liquidity, and the ability of international investors to participate reliably.
A potential transition from Emerging Market to Standalone Market status could have several consequences.
A. Benchmark-driven capital allocation
Many global investment mandates use MSCI indexes as benchmarks.
Some funds track indexes passively. Others manage actively but measure performance against the same benchmarks.
If Indonesian securities were removed from relevant MSCI emerging-market indexes, funds following those benchmarks could be required to reduce or eliminate their positions.
The effect would not necessarily be uniform across every listed company. It would depend on index membership, fund mandates, existing holdings, and how portfolios implement the reclassification.
B. Potential capital outflows
Reuters reported on October 16 that the potential reclassification could expose Indonesia to substantial capital outflows, with estimates reaching as much as US$19 billion across passive and active investment strategies.
This figure should be treated as an estimate of potential exposure—not a confirmed amount of future selling.
Actual outflows would depend on the final classification decision, investor behavior, market prices, and the response of domestic and international buyers.
The distinction is essential: potential benchmark-related outflows do not automatically translate into an equal amount of net selling at any specific price.
C. Lower demand for Indonesian equities
If international investors perceive Indonesian securities as less accessible or less suitable for benchmark-based portfolios, demand could weaken.
Lower demand can affect valuation multiples, liquidity, and the cost of equity capital.
Companies seeking to raise capital may also face a less favorable environment if investors demand greater compensation for perceived risks.
D. Higher risk premiums
Investors may demand higher expected returns to compensate for uncertainty about governance, market liquidity, and future capital flows.
In valuation terms, a higher required return reduces the present value of future cash flows, all else equal.
This can create a difficult situation: even profitable companies may trade at lower valuations if the market-wide risk premium increases.
E. A potential long-term credibility problem
The broader risk is not limited to passive fund flows.
A sustained loss of confidence could affect how international investors evaluate Indonesia as a destination for long-term capital.
Rebuilding that confidence requires more than short-term market support. It requires transparent ownership, consistent enforcement, credible disclosure, and evidence that market reforms are effective.
The key point: the threat is not simply that foreign funds might sell Indonesian shares. It is that investors may begin to assign a structurally higher risk premium to the market.
- Microeconomic Risks: Why the Damage Will Not Be Equal
An index decline of approximately 43% from its January peak does not mean every Indonesian company has lost the same proportion of fundamental value.
The impact depends on each company's financial structure, operating model, governance, and market liquidity.
Banks and financial institutions
Banks may be affected by weaker investor confidence, slower credit growth, changing funding costs, and potential deterioration in borrower quality.
However, a falling equity market does not automatically mean that banks are insolvent or that their loan books have deteriorated.
Investors should examine capital adequacy, non-performing loans, net interest margins, liquidity, and credit costs rather than relying exclusively on share-price movements.
Consumer companies
Consumer businesses may face pressure if household purchasing power weakens or consumers become more cautious.
Important variables include real wage growth, consumer confidence, input costs, pricing power, and inventory turnover.
Companies with strong brands and pricing power may be more resilient than businesses operating with thin margins and high fixed costs.
Property and construction
Property companies can be sensitive to interest rates, financing availability, consumer confidence, and government policy.
Higher borrowing costs may reduce affordability and delay investment decisions.
The relevant indicators include presales, cash flow, debt maturity, refinancing requirements, and the quality of the company's land bank.
Commodity producers
Mining, energy, and commodity-related companies are influenced by global commodity prices, production costs, exchange rates, and capital expenditure requirements.
Some exporters may benefit from a weaker rupiah, but that advantage can be offset by falling commodity prices, rising operating costs, or weaker global demand.
Commodity exposure should therefore be analyzed by business economics rather than treated as a universal hedge against Indonesian equity risk.
Highly concentrated or thinly traded stocks
Companies with concentrated ownership or limited effective free float may be especially vulnerable to liquidity shocks.
A stock can experience large price movements when the available supply of shares is small relative to selling demand.
In such circumstances, the quoted market capitalization may not represent the price at which a large position could actually be liquidated.
This distinction becomes particularly important during periods of market stress.
- Fundamental Value Versus Market Price
One of the most common mistakes during a crash is assuming that a lower price automatically means a better investment.
A stock that falls 40% is not necessarily undervalued.
The correct question is whether its price has fallen more than the present value of its future cash flows.
A simplified valuation framework is:
Equity Value = Present Value of Expected Future Cash Flows
The present value depends on several variables:
-
Revenue growth.
-
Operating margins.
-
Capital expenditure.
-
Working-capital requirements.
-
Tax obligations.
-
Financing structure.
-
Cost of equity and cost of debt.
-
Long-term competitive advantage.
If expected earnings decline while the required return increases, fair value may fall more sharply than the stock price alone suggests.
Conversely, a company with resilient cash flows, conservative leverage, strong governance, and a durable competitive advantage may become more attractive after an indiscriminate sell-off.
The challenge is distinguishing temporary liquidity-driven selling from a permanent deterioration in fundamentals.
This requires company-level research, not merely an index chart.
- IHSG Weekly Technical Analysis: What the Chart Suggests
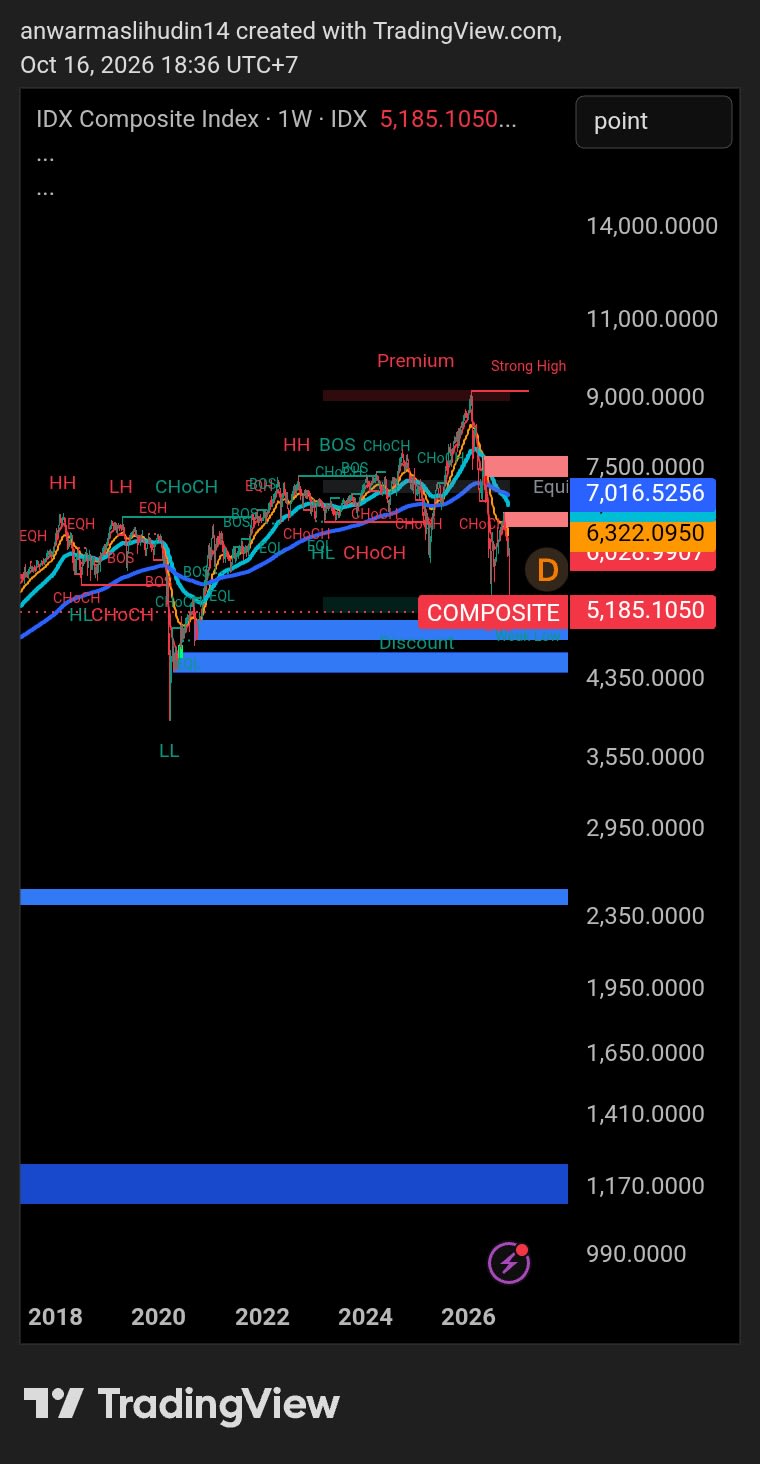
The weekly chart supplied for this analysis shows the IHSG at 5,185.10 on October 16,
It also displays several historical supply and demand zones, market-structure labels, and moving-average-style indicators.
Technical analysis does not establish why the market fell. It helps identify where price may encounter buying interest, selling pressure, or a change in trend behavior.
The following levels are approximate readings from the supplied screenshot and should be updated against a live chart before trading.
A. The Primary Trend: Bearish
The weekly structure has deteriorated significantly from the highs around 9,000.
Price has broken below several former trading zones and is now trading well beneath the prominent resistance areas shown on the chart.
The recent decline suggests that sellers have maintained control of the medium-term trend.
The important distinction is between a temporary rebound and a confirmed trend reversal.
A strong green candle or a short-term recovery would not, by itself, establish that the weekly downtrend has ended.
More convincing evidence would include:
-
A sustained recovery above a broken resistance zone.
-
Higher weekly swing lows.
-
A sequence of higher highs and higher lows.
-
Improved breadth across sectors.
-
Stronger buying volume during advances.
-
A recovery that holds through subsequent selling pressure.
Until these conditions emerge, rallies should be evaluated within the context of a damaged weekly structure.
B. Immediate Support: Around 5,000–5,200
The 5,000–5,200 area is the immediate zone to monitor, given the latest closing level of 5,185.10 and the psychologically important 5,000 threshold.
This is not guaranteed support. It is an area where price behavior could help distinguish between stabilization and continued liquidation.
A weekly close below 5,000, followed by a failed recovery, would increase the risk of further downside.
However, an intraday break below 5,000 would not automatically confirm a sustained breakdown. The weekly close, subsequent price action, and market breadth matter.
C. The Next Demand Zone: Approximately 4,800–4,350
The screenshot highlights a broad blue demand area below the current index level, extending approximately from the upper 4,000s toward 4,350.
This is the next major zone to watch if the index cannot hold around 5,000.
A demand zone represents a potential area of buying interest based on historical price behavior. It does not guarantee that buyers will defend the level.
If the market reaches this region, investors should examine whether selling pressure begins to diminish or whether price moves through the zone with little resistance.
A sharp decline through the entire area would indicate that the market is still searching for equilibrium.
D. First Meaningful Resistance: Approximately 6,300
The chart displays a prominent price reference around 6,322.
If the IHSG rebounds from current levels, this region is a potential resistance area where sellers may reappear.
A recovery toward 6,300 would be meaningful as a relief rally, but it would not automatically reverse the broader bearish trend.
The quality of the recovery matters more than the distance traveled.
A rebound with improving market breadth, stronger turnover in advancing stocks, and sustained weekly closes above resistance would be more constructive than a short-lived rally led by a few large-cap names.
E. Major Resistance: Approximately 7,000–7,500
The chart also shows an important reference around 7,016 and a supply region near 7,500.
These levels are materially above the current index price and represent a larger recovery challenge.
A move back toward this area would require more than a temporary improvement in sentiment. It would likely need a combination of lower perceived market risk, improved liquidity, stronger investor confidence, and evidence that selling pressure is easing.
A sustained recovery above these zones would improve the technical outlook.
Until then, they remain overhead resistance rather than immediate price targets.
F. Longer-Term Historical Zones
The chart also contains much lower historical reference zones near approximately 2,400 and 1,170.
These are distant levels shown by the supplied indicator and should not be interpreted as base-case forecasts or imminent downside targets.
They are included in the screenshot's broader historical structure, but the immediate technical assessment should focus on price behavior around 5,000, the 4,800–4,350 demand area, and the first meaningful resistance near 6,300.
Weekly Technical Summary
Technical factor| Current interpretation
Primary trend| Bearish
Current close| 5,185.10
Immediate area to monitor| 5,000–5,200
Next major demand zone| Approximately 4,800–4,350
First meaningful resistance| Approximately 6,300
Higher resistance| Approximately 7,000–7,500
Reversal confirmation| Sustained weekly recovery, higher swing lows, and broader participation
These levels are analytical reference points, not predictions with guaranteed outcomes.
- Three Possible Scenarios for IHSG
Rather than predicting a single outcome, a scenario-based framework helps investors prepare for different market conditions.
Scenario 1: Stabilization and Relief Rally
What would support this scenario?
-
MSCI-related uncertainty becomes more manageable.
-
Regulators provide credible evidence of market-governance improvements.
-
The rupiah stabilizes.
-
Foreign selling moderates.
-
IHSG holds the 5,000 area and begins forming higher weekly lows.
Under this scenario, the index could attempt a recovery toward 6,300.
A sustained move above that region would improve the technical picture, although higher resistance around 7,000–7,500 would remain relevant.
The main risk is mistaking a short-covering rally or temporary liquidity recovery for a durable bull market.
Scenario 2: Continued Consolidation Near the Lows
Under this scenario, the market remains volatile as investors wait for more information.
The index may trade unevenly around the 5,000 region while individual sectors and stocks diverge.
This outcome could occur if selling pressure slows but international investors remain cautious.
During such a phase, stock selection may become increasingly important because company-level earnings, valuation, governance, and liquidity will determine which businesses can attract sustainable demand.
However, sideways price action should not automatically be interpreted as accumulation. Confirmation requires observing how price behaves during both advances and declines.
Scenario 3: A Further Breakdown
The bearish scenario becomes more concerning if the IHSG closes below 5,000 on a weekly basis and fails to reclaim the level.
A sustained breakdown could expose the next demand zone around 4,800–4,350.
Risk would increase further if the move coincided with continued foreign outflows, rupiah weakness, worsening market liquidity, or a deterioration in the outlook for MSCI classification.
This scenario does not require every Indonesian company to experience a fundamental crisis.
It could result from a combination of benchmark-related selling, rising risk premiums, and a shortage of buyers willing to absorb supply at prevailing prices.
The distinction between price risk and fundamental risk remains important, but both can reinforce one another during a market-wide liquidation.
- What Could Change the Outlook?
The most important catalysts are not limited to technical indicators.
MSCI and market reforms
Investors should monitor official MSCI updates and evidence that Indonesia's proposed reforms are producing measurable improvements.
The decisive factors include the quality of ownership disclosure, free-float transparency, enforcement against market abuse, and the reliability of price discovery.
Announcements alone may not be sufficient to restore confidence.
Foreign investor flows
Sustained changes in foreign buying and selling can provide useful information about institutional positioning.
However, daily flows should not be interpreted in isolation. Their significance depends on market turnover, the stocks being traded, and whether the pattern persists.
Currency and bond-market conditions
The rupiah and government bond yields provide additional information about Indonesia's broader risk environment.
A stabilization in currency and bond markets could reduce pressure on equity valuations.
Conversely, renewed currency weakness and rising yields could reinforce the equity-market risk premium.
Corporate earnings and balance sheets
Investors should look beyond the index and assess whether earnings expectations are being revised downward.
Key indicators include cash-flow generation, debt maturity, refinancing needs, margins, dividend sustainability, and capital expenditure.
A market recovery supported by improving earnings quality would be more durable than one driven exclusively by short-term sentiment.
Market breadth and liquidity
An index can rebound even while most listed stocks continue to decline.
For that reason, investors should monitor how many stocks participate in a recovery, whether trading liquidity improves, and whether advances are sustained across sectors.
Broad participation would provide stronger evidence of a healthier market than a rally concentrated in a few large-cap constituents.
- What Should Investors Do During a Market Shock?
A major market decline creates two competing risks: selling at the worst possible moment and remaining exposed to risks that the portfolio cannot withstand.
A disciplined process should address both.
First, separate portfolio exposure from market opinion.
Believing that Indonesian stocks will eventually recover does not determine whether a particular portfolio can survive another substantial decline.
Position size, liquidity requirements, time horizon, and concentration matter.
Second, reassess each holding independently.
For every company, ask:
-
Has the investment thesis changed?
-
Are expected cash flows deteriorating?
-
Is leverage manageable?
-
Does the company have sufficient liquidity?
-
Is the stock's free float adequate for the intended position size?
-
Is the valuation attractive under conservative assumptions?
-
Could governance or ownership concerns affect investability?
Third, avoid assuming that all declines create value.
A falling price improves prospective returns only when the underlying asset's expected cash flows and risks justify the new valuation.
Fourth, define risk limits before volatility rises further.
Portfolio stress testing should consider additional market declines, currency depreciation, lower liquidity, wider bid–ask spreads, and the possibility that positions cannot be liquidated at expected prices.
Finally, distinguish a trade from an investment.
A short-term trade may depend on a defined technical setup and strict execution rules. A long-term investment requires a thesis grounded in business quality, cash flows, valuation, and the ability to tolerate uncertainty.
Combining the two without a clear framework can lead to inconsistent decisions.
- The Bigger Economic Lesson
The IHSG sell-off highlights an important principle: financial markets depend not only on economic growth but also on institutional credibility.
A country may have a large domestic economy, significant natural resources, established companies, and long-term growth opportunities. Yet those advantages do not automatically guarantee strong equity-market performance.
Investors also care about whether they can identify who owns a company, determine how many shares are genuinely tradable, trust financial disclosures, and rely on consistent enforcement of market rules.
When confidence in those mechanisms weakens, the required return on capital can rise.
That increase in the cost of capital affects more than stock prices. It can influence corporate financing, capital raising, investment decisions, and the attractiveness of future listings.
This is why market transparency and governance should be understood as economic infrastructure rather than merely regulatory obligations.
The challenge for Indonesia is not simply to prevent the next sharp decline. It is to demonstrate that its capital market can provide reliable access, credible price discovery, and consistent investor protection.
A stronger institutional framework would benefit domestic investors as well as international institutions.
Conclusion: The Next Move Depends on More Than the Chart
The IHSG's decline from a January peak above 9,000 to 5,185.10 on October 16, 2026, reflects a convergence of macroeconomic pressure, foreign-investor caution, market-structure concerns, and a major new source of uncertainty surrounding MSCI classification.
The immediate technical picture remains bearish.
The 5,000 area is a key level to monitor, with a lower demand zone around 4,800–4,350 if the market experiences a sustained breakdown. On the upside, 6,300 represents an initial resistance area, followed by a more substantial challenge around 7,000–7,500.
These levels do not determine the outcome. They provide a framework for evaluating how the market responds to new information.
A sustainable recovery would require more than a short-term bounce. It would benefit from credible market reforms, improved investor confidence, stable macroeconomic conditions, and stronger participation across listed companies.
The most important question for investors is therefore not simply whether IHSG has fallen far enough.
It is whether the relationship between price, fundamental value, liquidity, and market risk has become attractive enough to justify taking additional exposure.
In uncertain markets, protecting capital and maintaining analytical discipline are more important than predicting the exact bottom.
Research and Further Reading
The analysis draws on public reporting and official statements from MSCI, Reuters, Katadata, and Indonesian financial-market sources. Readers should consult the original publications for the latest updates, as the MSCI consultation and market conditions may change.
Suggested SEO keywords: IHSG 2026 crash, IHSG prediction, Indonesian stock market, MSCI Indonesia downgrade, MSCI standalone market, IHSG technical analysis, Indonesia foreign capital outflows, IHSG support and resistance, Indonesian equity market outlook.
Disclaimer: This article is for educational and informational purposes only. It is not investment advice, a recommendation to buy or sell securities, or a guarantee of future market performance. Technical levels are approximate readings from the chart supplied for this analysis. Investors should conduct independent research and assess their own risk tolerance before making investment decisions.
Quantitative Investment Research
Explore more market research and investment insights at ecosystemamcapital.xyz.